Debugger for Adobe Analytics
插件截图
插件概述
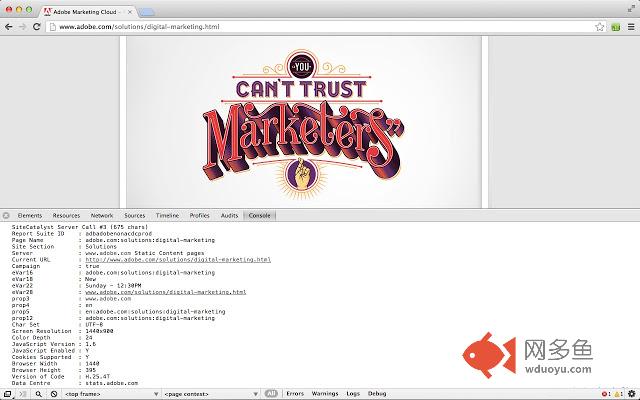
Prints to JavaScript console what data is sent to Adobe Analytics.插件详情
To see what data is being sent in JS console:- On Windows press ctrl+shift+j
- On Mac press alt+cmd+j
Adobe Analytics Debugger for POST and GET requests. Prints following info:
- displays all page load data, link events, file downloads
- shows information about data collection servers and informs if it is an RDC server or not
- provides recommendations on how to improve the implementation
- displays Adobe Marketing Cloud visitor ID and Adobe Marketing Cloud organisation ID
Release Notes
v1.4
+ super long post calls are not truncating anymore
+ server calls are now printed in a tab where a request originated
+ added s.pageType, s.zip
+ fixed URI decoding issues
+ custom and downloads calls will not show footer (data center, cookies, JS version, library version)
v1.3
+ very long post server calls are working now!
Big thanks to richard.mueller@newellco.com for fixing this
+ added grouping and colours
+ shows context variables
+ cookie information - first or third party
+ shows s.tnt variable
v1.2
+ display AMC org ID
+ provide recommendations
v1.1
+ showing visitor IDs from vid(s.visitorID), aid(legacy s_vi cookie), mid(marketing cloud id)
+ added new RDC domain - Singapore and Pacific Northwest (sc.omtrdc.net)
+ showing list eVars
+ hidden unimportant data such as browser and screen information
+ by default the debugger is ON now
其他信息
官方唯一标识:bdingofl****************pjeclmof
官方最后更新日期:2019年3月28日
分类:生产工具
大小:15.17KiB
版本:1.4.3
语言:English
提供方:none
星级:4.5
插件下载
| 下载链接一 下载链接二 |
| Chrome插件离线安装教程 |
温馨提示
本站中的部份内容来源网络和网友发布,纯属个人收集并供大家交流学习参考之用,版权归版权原作者所有。
如果您发现网站上有侵犯您的知识产权的作品,请与我们取得联系,我们会及时修改或删除。
如果您觉得网多鱼对您有帮助,欢迎收藏我们 Ctrl+D。