Symfony2 Profiler shortcut
插件截图
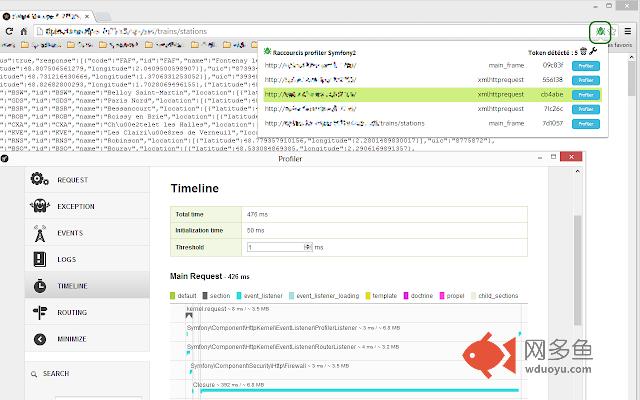
插件概述
Symfony2 Profiler shortcut插件详情
Give access to Symfoy 2 Profiler if any Response from a server is made with the "X-Debug-Token". Very useful for REST & AJAX Development/testing# Last update :
- No more 404 with the profiler url picker
- UI performance improved
# In details
This is an extension that help developer and/or tester to see relevant information on Symfony 2 based applications.
When you enable debug mode, you probably noticed a toolBar at the bottom. Very useful, clicking on it lead the the Profiler.
The profiler make easy to access logs and many information about the current request.
This extension is here to allow you to access easily to the fofiler event if the debug toolbar is disabled or not shown.
If you already made REST application with Symfony2 framework, you know that the Debug tool bar only show up if you render a real webPage.
If you render JSON or XML, you just have the result and to go to the Profiler is a long way.
Actually, if you look at the Response headers, you'll notice a "X-Debug-Token:0b274e"; This is the key to go to the debugger.
This extension can help you to open the profiler of AJAX/XHR request made on your website.
其他信息
官方唯一标识:denlhpha****************gbknmmon
官方最后更新日期:2015年8月19日
分类:开发者工具
大小:439KiB
版本:0.6.3
语言:支持2种语言
提供方:none
星级:4.8
插件下载
| 下载链接一 下载链接二 |
| Chrome插件离线安装教程 |
温馨提示
本站中的部份内容来源网络和网友发布,纯属个人收集并供大家交流学习参考之用,版权归版权原作者所有。
如果您发现网站上有侵犯您的知识产权的作品,请与我们取得联系,我们会及时修改或删除。
如果您觉得网多鱼对您有帮助,欢迎收藏我们 Ctrl+D。