Node Debugger
插件截图
插件概述
Debug Node in Chrome devtools插件详情
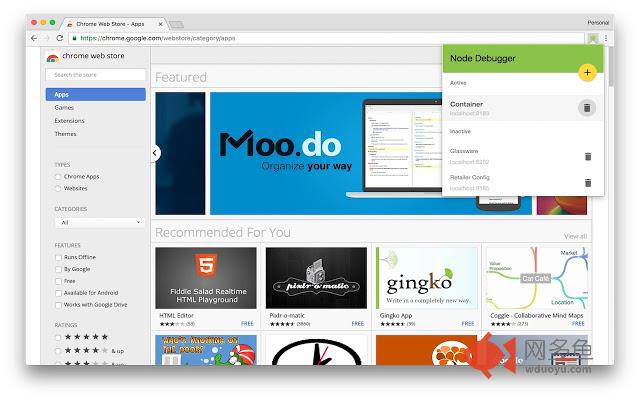
Connect to v8 inspector debugging instances! This extension allows you to save configured debugging sessions and will automatically check them for availability on startup.To quickly get started you can do the following:
- Start a node 6.3+ process with the --inspect flag set (this will start a debugging session at localhost:9229)
- Click on the extension icon in Chrome and see that the Default session is available.
- Click on the Default session and a new Chrome window will load with the devtools connected to node.
- Carry on making great apps!
Roadmap ahead:
- Attempt to detect when the debugger goes offline (this happens frequently in development with Nodemon) and attempt to reconnect automatically
其他信息
官方唯一标识:onmjjpak****************maedeipb
官方最后更新日期:2016年10月28日
分类:开发者工具
大小:2.2MiB
版本:0.6.0
语言:English (United States)
提供方:none
星级:5
插件下载
| 下载链接一 下载链接二 |
| Chrome插件离线安装教程 |
温馨提示
本站中的部份内容来源网络和网友发布,纯属个人收集并供大家交流学习参考之用,版权归版权原作者所有。
如果您发现网站上有侵犯您的知识产权的作品,请与我们取得联系,我们会及时修改或删除。
如果您觉得网多鱼对您有帮助,欢迎收藏我们 Ctrl+D。