JProfiler Origin Tracker
插件截图
插件概述
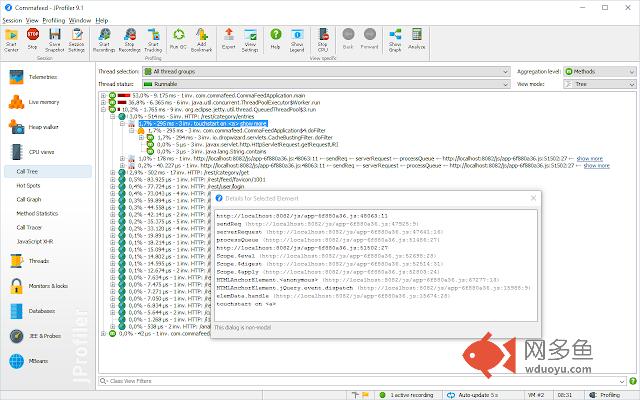
Tracks XHR and fetch requests to your profiled Java app and shows JavaScript stack traces as origins within JProfiler插件详情
JProfiler is an all-purpose profiler for the Java virtual machine (JVM). As part of its CPU profiling capabilities, JProfiler can track execution from JavaScript code in the browser to a JVM that is handling XHR or fetch requests.The call tree will be split for each separate JavaScript stack trace at the time of the XHR request and the full stack trace is available in the node detail dialog. A dedicated "JavaScript XHR" view shows the JavaScript call tree of all XHR calls that were handled in the profiled backend together with hyperlinks that take you to the execution site.
The extension adds a button to the toolbar for starting and stopping the XHR tracking.
其他信息
官方唯一标识:mnicmpkl****************hdfnmmbm
官方最后更新日期:2019年4月6日
分类:开发者工具
大小:21.55KiB
版本:1.0.2
语言:English
提供方:ej-technologies.com
星级:3.7
插件下载
| 下载链接一 下载链接二 |
| Chrome插件离线安装教程 |
温馨提示
本站中的部份内容来源网络和网友发布,纯属个人收集并供大家交流学习参考之用,版权归版权原作者所有。
如果您发现网站上有侵犯您的知识产权的作品,请与我们取得联系,我们会及时修改或删除。
如果您觉得网多鱼对您有帮助,欢迎收藏我们 Ctrl+D。