AJAX Debugger
插件截图
插件概述
Logs all AJAX activity to the Dev Tools Console, allowing inspection of AJAX calls, and open calls in new tab with all the inputs.插件详情
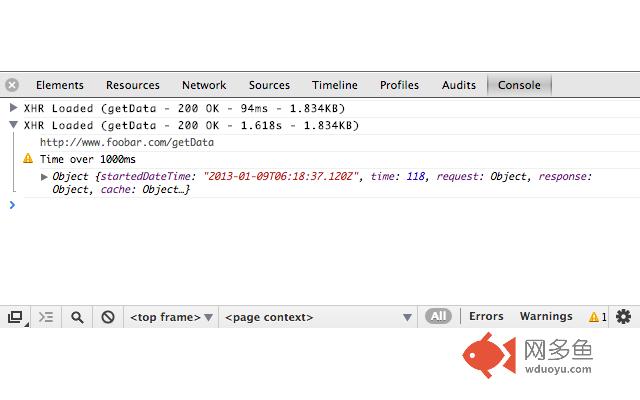
AJAX Debugger will log all AJAX (XMLHttpRequest) activity to Chrome's Developer Tools Console. This allows developers to easily see top-level request info, like the HTTP status, response time, and size. Click the URL to open the AJAX call in a new tab, including all the inputs, making debugging much easier. You can even drill down to see all the low-level request details including the HTTP header information.Logged data includes:
• File called
• Response Status
• Response Time
• Response Size
• AJAX source link with all input params
• Object containing all request and response details
• Response content (optional)
• Warning if response takes longer than set time
Logo & promo design by Andy Merskin
其他信息
官方唯一标识:lgfefckp****************fbcgedam
官方最后更新日期:2013年11月20日
分类:开发者工具
大小:48.38KiB
版本:1.0.4
语言:English (United States)
提供方:none
星级:4
插件下载
| 下载链接一 下载链接二 |
| Chrome插件离线安装教程 |
温馨提示
本站中的部份内容来源网络和网友发布,纯属个人收集并供大家交流学习参考之用,版权归版权原作者所有。
如果您发现网站上有侵犯您的知识产权的作品,请与我们取得联系,我们会及时修改或删除。
如果您觉得网多鱼对您有帮助,欢迎收藏我们 Ctrl+D。